Nothing seems to intrigue folks more than the BLOB, the area of warm water over the northeast Pacific. Since this blog provides cutting-edge science to its readers, I am going to provide a first: a BLOB forecast.

First, I have major news: the BLOB has already begun to weaken, as illustrated by maps of sea surface temperature (SST) anomaly (difference from normal) on Sept 16th and 29th.

But this is just the start. The BLOB is associated with persistent high pressure over the eastern Pacific, since high pressure produces weaker winds and less stirring of cold water to the surface. And high pressure also does other favorable things with the ocean currents.
The BLOB revved up over the summer because of persistent high pressure, something illustrated in the following map, which shows the upper level (500 hPa) height anomaly (difference from normal) for the past 90 days. You see the orange color (highest heights than normal) over the NE Pacific? That is what did the job.

But recently that has changed. Here is the same type of map for the last 7 days...lower than normal heights/pressure has moved in (blue colors). Bad for BLOB.

Turning to the forecast, lets look at ensemble forecasts (actually the average of many forecasts) for the same field (differences from climatology aloft) at a few times in the future (48 h, 120h, 336 h). Lots of blue and purple, which denotes troughing (low pressure)--just the opposite of what strengthens the BLOB.


Finally, the National Weather Service runs a coupled atmosphere/ocean model called CFS and here are its forecasts of sea surface temperature anomalies for the next four weeks. The sea surface is cooling and BLOB is dying.
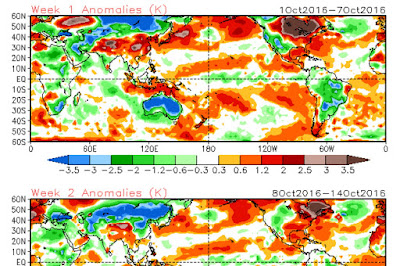

I know this analysis will bring sadness to BLOB lovers, but I have to be honest. The BLOB is going to weaken over the next few weeks, something that should bring joy to Northwest snow lovers.

First, I have major news: the BLOB has already begun to weaken, as illustrated by maps of sea surface temperature (SST) anomaly (difference from normal) on Sept 16th and 29th.


But this is just the start. The BLOB is associated with persistent high pressure over the eastern Pacific, since high pressure produces weaker winds and less stirring of cold water to the surface. And high pressure also does other favorable things with the ocean currents.
The BLOB revved up over the summer because of persistent high pressure, something illustrated in the following map, which shows the upper level (500 hPa) height anomaly (difference from normal) for the past 90 days. You see the orange color (highest heights than normal) over the NE Pacific? That is what did the job.

But recently that has changed. Here is the same type of map for the last 7 days...lower than normal heights/pressure has moved in (blue colors). Bad for BLOB.

Turning to the forecast, lets look at ensemble forecasts (actually the average of many forecasts) for the same field (differences from climatology aloft) at a few times in the future (48 h, 120h, 336 h). Lots of blue and purple, which denotes troughing (low pressure)--just the opposite of what strengthens the BLOB.


Finally, the National Weather Service runs a coupled atmosphere/ocean model called CFS and here are its forecasts of sea surface temperature anomalies for the next four weeks. The sea surface is cooling and BLOB is dying.
I know this analysis will bring sadness to BLOB lovers, but I have to be honest. The BLOB is going to weaken over the next few weeks, something that should bring joy to Northwest snow lovers.

Post a Comment