This has been an extraordinarily wet year over the entire west coast of the U.S., with many locations approaching or exceeding all time record precipitation amounts for the water year (which starts October 1).
The question is why?
A number of media outlets and environmental advocacy groups are claiming (or strongly suggesting) that the heavy rainfall this year and the preceding dry period over California are the result of human-caused global warming.


Is human-induced global warming associated with increasing greenhouse gases really the cause?
I believe that the evidence and good sciences indicates that the answer is no--the nature of what happened this year does not reflect what we expect from global warming. Let me provide you with the evidence.
The precipitation that has hit California this winter has been truly extraordinary. I mean crazy high.
Want proof? The State of California has an index of Northern Sierra Precipitation for the total amount starting October 1. Yesterday, we beat the all time record for entire water year, and there is 5.5 months left in the water year. This is a startling record to break.

Here is the percentage of normal precipitation for the western U.S. for the water year so far. Your eyes are not lying to you....much of norther Sierra and neighboring areas had over 200% of normal precipitation.

How much above normal does this mean in inches? As shown in the figure below for the same period, we are talking over TWENTY inches more than normal from central CA to the Pacific Northwest. Amazing.

So much precipitation that most of the reservoirs in California went from well below normal to full. No one expected that.
Now some in the media and some "advocacy" groups have been suggesting or stating that the heavy this year is the result of or "consistent with" the effects of global warming. But they are not providing a scientifically based conclusion.
(As an aside, this is an area in which I have done research and have published several papers in the peer-reviewed literature.)
There is a substantial literature on the impacts of global warming on West Coast precipitation. A number make use of the output of global climate models forced by increasing greenhouse gases.
An excellent paper by Neelin et al., 2013 in the Journal of Climate presented the average change in precipitation for December through February from a 15-member ensemble of the latest (CMIP-5) climate models (see below). This map shows the difference between the precipitation between the end of the 20th and 21st centuries if greenhouse gases increase rapidly (RCP 8.5). Note that there is small increase over southern California and a modest increase (about .5-1 mm per day or around 1.75 to 3.5 inches) for the entire winter. And keep in mind, this is the magnitude of the change by the end of the century, today, the impacts of global warming would be much, much less (perhaps a tenth of this).
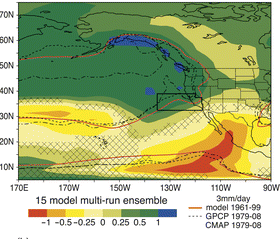
Clearly, the precipitation enhancement this winter is hugely greater than expected from global warming. These results also speak to the precipitation droughts of the past few years--this is NOT what climate models are suggesting will occur from global warming. California will not be getting less precipitation as the planet warms (although Mexico will get drier)

Climate models do suggest that the largest atmospheric rivers will get much more intense--my work with Dr. Mike Warner in published work in the Journal of Geophysical Research suggests that the strongest atmospheric rivers will be enhanced by 30-40%. But that is not what what observed this winter; although we had a few strong atmospheric rivers, none were exceptional, something that is supported by the lack of major flooding events along the West Coast.
Instead of mega atmospheric rivers, West Coast precipitation was characterized by a seemingly unending number of modest events. This is made evident by the precipitation record at San Francisco below (dark green is actual precipitation and light green is normal).


Furthermore, the origin of the persistent precipitation is no mystery--it was due to a very persistent and anomalous upper atmospheric circulation pattern.
To illustrate, here is upper atmospheric (500 hPa, around 18,000 ft) anomaly (difference from normal) of 500 hPa heights (you can think of it like pressure) for the last 90 days. Huge anomaly, with unusually low pressure over the Northwest and offshore waters, a big ridge (high pressure) over the eastern U.S. and the southern NE Pacific, and other large anomalies offshore.
 A low off our coast and a ridge to our south brings moist southwesterly flow and lots of precipitation over the West Coast. This pattern may well have been forced by unusual convection (thunderstorms) over the Indonesian and environs.
There is no reason to expect this kind of pattern is caused by global warming, since the climate models do not produce this configuration when they are forced by increasing greenhouse gases.
Not convinced yet? If global warming caused by steadily increasing greenhouse gases was the cause of the recent drought or this year's mega precipitation, you would expect to see a trend in California precipitation. As you can see below (a plot of Oct-March precipitation over CA from the Western Region Climate Center), there is very little trend (I would not look before 1940 since there was far fewer stations then). California has a lot of natural variability of precipitation with a few dry years followed by a very wet year or two. But there is no real trend. Global warming would produce a trend.
In summary, examining the California precipitation variability from a number of directions leads to the same, consistent conclusion: there is no scientific evidence or reason to believe that recent variations in precipitation have anything to do with global warming.
____________________
For those that are interested, I will be giving a talk at Bellevue College next Tuesday (April 18th) on the politicization of climate science at 12:30 PM. This is open to the public. And they have pizza.

_______________________
How will Northwest Weather Change Under Global Warming? Help Us Determine the Local Impacts of Climate Change
Society needs to know the regional impacts of climate change and several of us at the UW are trying to provide this information with state-of-the-art high resolution climate modeling. With Federal funding unavailable, we are experimenting with a community funding to build this effort. If you want more information or are interested in helping, please go here. The full link is: https://uw.useed.net/projects/822/home All contributions to the UW are tax deductible.
The question is why?
A number of media outlets and environmental advocacy groups are claiming (or strongly suggesting) that the heavy rainfall this year and the preceding dry period over California are the result of human-caused global warming.
Is human-induced global warming associated with increasing greenhouse gases really the cause?
I believe that the evidence and good sciences indicates that the answer is no--the nature of what happened this year does not reflect what we expect from global warming. Let me provide you with the evidence.
The precipitation that has hit California this winter has been truly extraordinary. I mean crazy high.
Want proof? The State of California has an index of Northern Sierra Precipitation for the total amount starting October 1. Yesterday, we beat the all time record for entire water year, and there is 5.5 months left in the water year. This is a startling record to break.

Here is the percentage of normal precipitation for the western U.S. for the water year so far. Your eyes are not lying to you....much of norther Sierra and neighboring areas had over 200% of normal precipitation.

How much above normal does this mean in inches? As shown in the figure below for the same period, we are talking over TWENTY inches more than normal from central CA to the Pacific Northwest. Amazing.

So much precipitation that most of the reservoirs in California went from well below normal to full. No one expected that.
Now some in the media and some "advocacy" groups have been suggesting or stating that the heavy this year is the result of or "consistent with" the effects of global warming. But they are not providing a scientifically based conclusion.
(As an aside, this is an area in which I have done research and have published several papers in the peer-reviewed literature.)
There is a substantial literature on the impacts of global warming on West Coast precipitation. A number make use of the output of global climate models forced by increasing greenhouse gases.
An excellent paper by Neelin et al., 2013 in the Journal of Climate presented the average change in precipitation for December through February from a 15-member ensemble of the latest (CMIP-5) climate models (see below). This map shows the difference between the precipitation between the end of the 20th and 21st centuries if greenhouse gases increase rapidly (RCP 8.5). Note that there is small increase over southern California and a modest increase (about .5-1 mm per day or around 1.75 to 3.5 inches) for the entire winter. And keep in mind, this is the magnitude of the change by the end of the century, today, the impacts of global warming would be much, much less (perhaps a tenth of this).

Clearly, the precipitation enhancement this winter is hugely greater than expected from global warming. These results also speak to the precipitation droughts of the past few years--this is NOT what climate models are suggesting will occur from global warming. California will not be getting less precipitation as the planet warms (although Mexico will get drier)
Climate models do suggest that the largest atmospheric rivers will get much more intense--my work with Dr. Mike Warner in published work in the Journal of Geophysical Research suggests that the strongest atmospheric rivers will be enhanced by 30-40%. But that is not what what observed this winter; although we had a few strong atmospheric rivers, none were exceptional, something that is supported by the lack of major flooding events along the West Coast.
Instead of mega atmospheric rivers, West Coast precipitation was characterized by a seemingly unending number of modest events. This is made evident by the precipitation record at San Francisco below (dark green is actual precipitation and light green is normal).

Seattle-Tacoma Airport experienced the same thing. Here is the plot of daily rainfall (red color) and the daily records (green lines). Rain nearly every day, but very few events reached daily records. Not what you would expect from a global warming signal.

Furthermore, the origin of the persistent precipitation is no mystery--it was due to a very persistent and anomalous upper atmospheric circulation pattern.
To illustrate, here is upper atmospheric (500 hPa, around 18,000 ft) anomaly (difference from normal) of 500 hPa heights (you can think of it like pressure) for the last 90 days. Huge anomaly, with unusually low pressure over the Northwest and offshore waters, a big ridge (high pressure) over the eastern U.S. and the southern NE Pacific, and other large anomalies offshore.

There is no reason to expect this kind of pattern is caused by global warming, since the climate models do not produce this configuration when they are forced by increasing greenhouse gases.
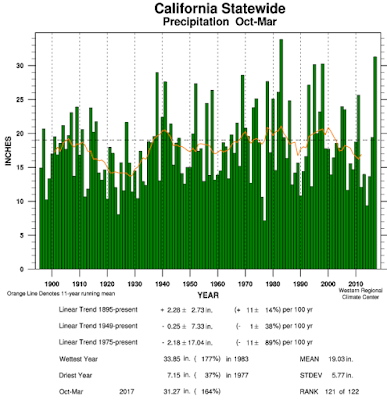
Not convinced yet? If global warming caused by steadily increasing greenhouse gases was the cause of the recent drought or this year's mega precipitation, you would expect to see a trend in California precipitation. As you can see below (a plot of Oct-March precipitation over CA from the Western Region Climate Center), there is very little trend (I would not look before 1940 since there was far fewer stations then). California has a lot of natural variability of precipitation with a few dry years followed by a very wet year or two. But there is no real trend. Global warming would produce a trend.

In summary, examining the California precipitation variability from a number of directions leads to the same, consistent conclusion: there is no scientific evidence or reason to believe that recent variations in precipitation have anything to do with global warming.
____________________
For those that are interested, I will be giving a talk at Bellevue College next Tuesday (April 18th) on the politicization of climate science at 12:30 PM. This is open to the public. And they have pizza.

_______________________
How will Northwest Weather Change Under Global Warming? Help Us Determine the Local Impacts of Climate Change
Society needs to know the regional impacts of climate change and several of us at the UW are trying to provide this information with state-of-the-art high resolution climate modeling. With Federal funding unavailable, we are experimenting with a community funding to build this effort. If you want more information or are interested in helping, please go here. The full link is: https://uw.useed.net/projects/822/home All contributions to the UW are tax deductible.
Post a Comment